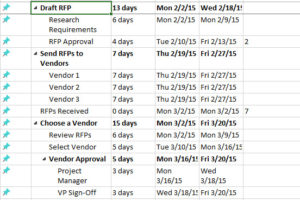
In this silent video, you’ll learn how to create a Gantt Chart with shapes for a data that uses smaller increments.
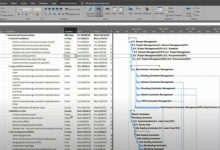
Step 1 Build the View
1. Create a Calculated Field such as (DATEDIFF(‘second’,[Start],[Stop]))/86400
2. Drag “Start” to the Columns shelf.
3. On the Columns shelf, right-click the “Start” field, and then select Exact Date.
4. Drag “Event” to the Rows shelf and to Color on the Marks card.
5. If it is not set by default, select Gantt Bar on the Marks card drop-down menu
6. Drag “Duration in Days” to Size.
7. Right-click the x-axis, and then select Edit Axis.
For full details on the steps, please refer to the aforementioned Knowledge Base article to view the calculation used in this example.
Step 2: Add Shapes
1. Reproduce all the steps from Step 2: Build the view.
2. In the “Start (2)” card change the type from Gantt Bar to Shape.
3. Remove “Sum(Duration in Days)” from Size.
4. Drag “Event” to Shape.
5. (Optional) Modify the shapes and the colors as desired.
6. Right-click the second “Start” field and select Dual Axis.
7. Right-click the top header and select Synchronize Axis.
8. In the “Start” card click the color option and lower the Transparency to 50%.