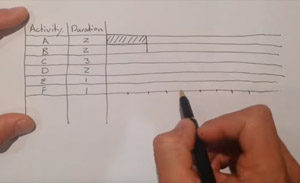
The Gantt chart is also known as the bar chart. It uses a bar chart to show the project, progress, and the progress of the system and other time related system progress. Named after the author, Mr. Henrry L. Ganntt.
Named after Henry Gantt, Gantt charts are now a staple tool in project planning and project management.
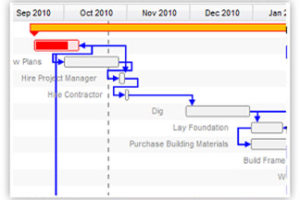
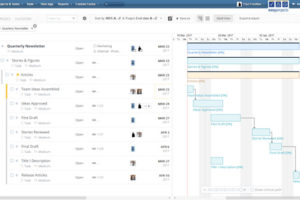
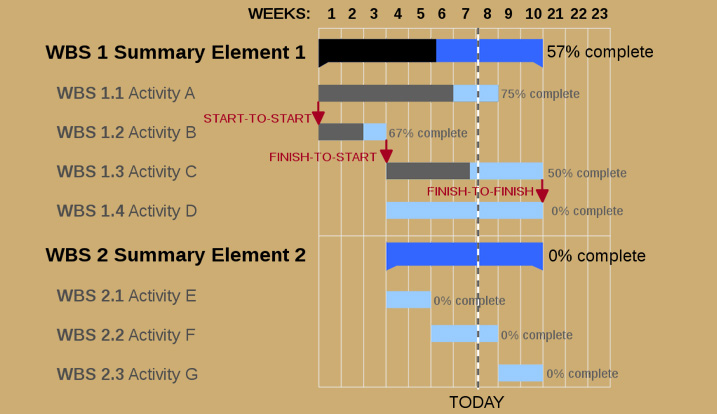
Gantt charts are interactive bar charts that help managers and teams completely outline and schedule projects on a timeline. They allow you to illustrate and visualize every step from day one to the end, connect tasks with dependent relationships, and track project progress to make sure you’ll meet your projected deadline.
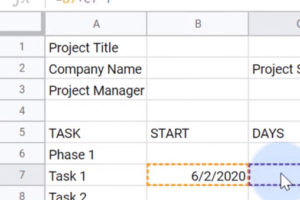
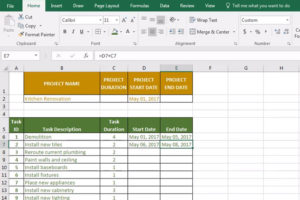
With a properly set up Gantt chart, you’ll know immediately when your project is on its way to being overdue. Each individual task for the project is given a set start date and due date, so if something is not happening on time, managers know immediately. Gantt charts can also be used for production planning, employee scheduling, and resource management.