In the field of work efficiency and time management, Gantt chart is absolutely the existence of seniors. But this concept is not yet well known to the public. As a pioneer in the field of time management, we feel that we have this responsibility and need to drive everyone together to understand time management and improve work efficiency. And Gantt Chart is an indispensable part of it. Let’s start with the concept. Let’s introduce Gantt Chart and how to use Gantt Chart to improve work efficiency.
Gantt chart originated during World War I, and matured in the 1920s as a production planning tool for mass production planning, but it was not used for project management and work planning.
It initially linked the production requirements of time series to various project parts to further determine the daily production volume.
Founder Gant pointed out that proper planning and control involves’… There are two scales, (1) what each worker should do and is doing, (2) the amount of work to be done. This is the origin of Gantt chart.
The simplicity and comprehensibility of Gantt charts made him very popular during the war years. However, the inconvenience of paper charts and production planning boards led to the limitation of information processing. People at that time encountered difficulties in improving Gantt charts. The complexity of mass production was not suitable for Gantt charts at that time.
Later, project management began to use the combination of Gantt chart and network computer network.
In the 1960s, Gantt chart as a supplementary method of project planning and management began to become prominent. Subsequently, the prosperity of microcomputers and personal computers stimulated the revival of Ganttu.
Subsequently, in various fields, with continuous optimization and resource filling, Ganttu’s vitality has been vigorous, has been used by enterprises to this day.
Gantt chart enables the project manager to ensure that his commitment to customers is fulfilled, even if there are problems, it can be targeted and notified in advance.
There are three points to note: 1. Consider the whole production process. 2. Suitable for sales-driven production. 3. The whole process is a solution program, and the plan is built to fulfill the order commitment.
1 Definition:
Firstly, Gantt chart is a dispatcher of production planning and project management; secondly, it is a top-down management tool.
The Gantt chart provides a clear overview of the plan:
A planned single job task; the relationship between tasks; the progress of each task; the duration of each task and the overall plan; all resources and their utilization; dependencies between parts; the impact of schedule changes; and a visual alert in case of plan conflict.
2 Dimensions:
A clear overview of time and events.
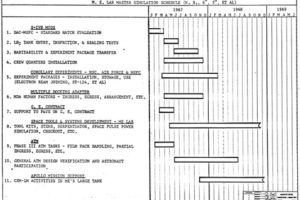
Gantt chart is a two-dimensional plan. The crossbar shows the start and end time of each work. The length of the crossbar indicates the duration of the work. The time dimension determines the roughness of the project plan. According to the needs of the project plan, hours, days, weeks and months can be used as time units to measure the progress of the project.
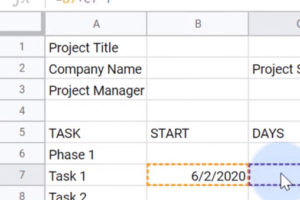
This example is a typical Gantt chart format. It shows how Gantt chart formats can be applied to a day’s time frame. In this case, the Gantt chart format is used to display the university curriculum schedule. Different color bars are used to represent different disciplines (red for language art, green for science, etc.).
3 Other resources:
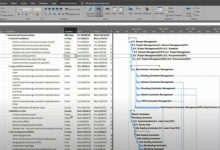
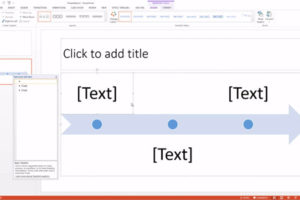
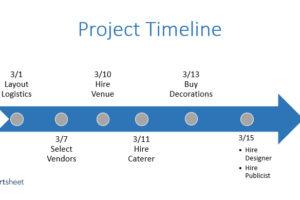
Important nodes/milestones/events, auxiliary resources (including manpower, material resources, tools, soft power, etc.), progress status, and dependencies between events.
Milestone maps depict important events along the timetable, and indicate that milestone Gantt maps between them are often used for top-level reporting, so that management does not become a project or the details of the project get deeper and deeper. Milestones: Important checkpoints or mid-term goals for a project. Resources: For team projects, it often helps to have additional columns containing numbers or abbreviations that identify who is responsible for the team. Status: Project progress, charts are updated by filling in the task bar to the length proportional to the amount of work completed. Dependency: A basic concept in which some activities depend on other activities being completed first.
4 key features:
Solve problems using systems rather than algorithms. If problems arise, develop a more effective operational system and process, rather than a solution to individual problems.
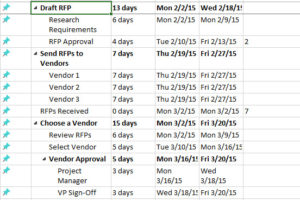
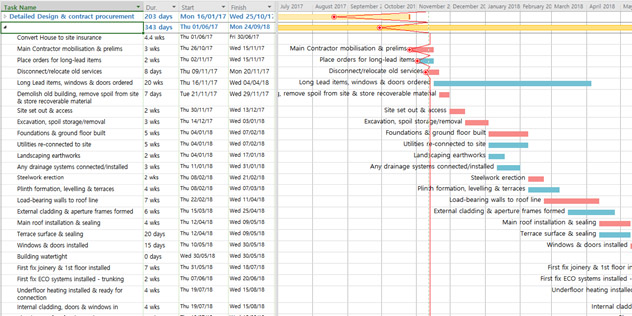
This is a basic Gantt chart example. Each task uses a yellow triangle to indicate the start date of the task and a green inverse triangle to indicate the completion date of the task.
5 Four advantages:
Intuitive, quick start, light start: The basic idea and inherent simplicity of Gantt Chart is amazing, displaying task activities and their duration with a timetable, resources and color bars. That’s it.
Human intuition allows everyone to quickly understand how to use Gantt charts. Starting with one of your ideas, it’s easy to start making a Gantt chart without considering other things.
Cleanness, Bridge, Communication: As a bridge between work and management, he is intuitive, easy to understand, and is a common language between management and employees.
As a tool, it provides the most basic and common information for managing and measuring the execution of the whole team.
Reducing the burden of reporting is straightforward: few people at work like to report on their own initiative, regardless of whether they are active or not.
The intuition of Gantt chart can clearly show the progress and completion status of the project from the visual effect.
The best way to improve efficiency and record: Many companies have a repetitive process of projects and production activities. Through the visual planning and tracking records of Gantt chart, this intuitive and clear working process can be handed over to any new employee, which can make people follow a path and grasp quickly, which greatly improves the organizational efficiency.
Provide insight, more transparent: Gantt chart provides strong insight. We take the time axis, resources and tasks as nodes, and present building blocks one by one on the table, which can clearly show the relationship between the various parts.
Gantt charts not only show the sequence of projects, but also provide important process management paths to guide the dispatcher’s attention to the most important part.
Management relief, accountability: A significant value of this transparency and insight is that there are obvious benefits to management.
With clear process steps, any employee can plan his or her work reasonably, thus avoiding delays and other misunderstandings of responsibility.
“I know my assignment is late, but I don’t know, it has such a big impact on the whole process.” It’s hard for people to say that in the face of Ganttu. The tasks are transparent, the key path is visual, and the responsibility is clear.