Do you have trouble managing multiple projects? After all, a website redesign or a content strategy requires serious team collaboration. Once you wrangle together a team, how predictable are things going forward? How can you use everything your team has to offer in ways that work for them? How can you be more productive using the least amount of costs?
These are questions project managers ask themselves for every fresh project. Tools range from a to-do list to a complex app suite. The main goal is utilizing everybody’s strengths and keeping the entire project scope clear. This is where Gantt charts come in. Sound familiar? Some of you may have heard of them, but just can’t see the benefit.
On the other hand, we’re surprised to hear some project managers haven’t even heard of them. Whatever boat you’re in, Gantt charts have potential to be the difference you’re looking for. In this article, we will make it crystal-clear what Gantt charts are and how they help you.
So What Is a Gantt Chart Anyways?
Simply put, a Gantt chart is a horizontal graph used to track specific tasks in a project. Sounds simple, right? A Gantt chart allows managers to easily allocate team members to specific tasks, all in a chosen time frame. Gantt charts range from a scratchy wireframe drawing to a full-fledged software solution.
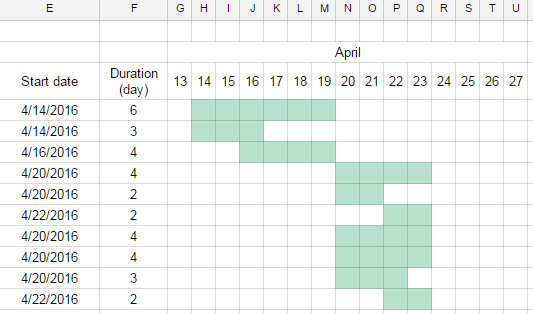
Modern Gantt chart tools aim to be as extensive and flexible as possible. As a result, Gantt Chart tools are more common. Though, you don’t have to use fancy software to create a chart. Some managers use something like Google Sheets, or good ol’ pen and paper.
As long as there is a time bar at the top with assigned team tasks, you have yourself a Gantt chart.
The Anatomy of a Gantt Chart
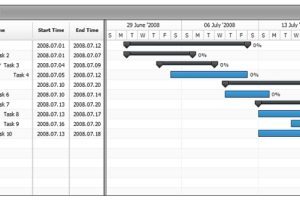
The makeup of a chart is simple. There are three parts: the timeframes, the task list, and the bar graph. You can use these simple parts to create your own chart, or immediately understand any software out there.
Timeframes
The timeframe is almost always located at the top, from left to right. The timeframe is usually in day/week format. For example: 5/7, 5/9, 5/11… and so on. In the example, the timeframe lists each day of the month. Its job is to indicate the project scope. The timeframe is almost always changed, so it needs to be flexible.
Task List
The tasks are usually in list format, located left of the chart. The tasks vary from project to project. In the example, there are multiple lists, organized into categories.
A task list for website redesign may look like:
*Photoshop PSD
* Create HTML5 template
*Create content
*Copywriting
The lists don’t have to be in any particular order. The task list simply contains activities that you want to assign to a team member. In some cases, multiple team members.
Bar Graph
This is the real meat of a Gantt chart. This is the horizontal graph that assigns team members to a task. A single bar has a horizontal length, which indicates how long a task takes to be completed. If you plan to take a week to create a blog post, you make its bar range from 5/11 to 5/18.
If you ever need to change the date, simply extend the bar or move it. Cool, right? Bars can easily overlap since they each have their own row. This makes planning tasks a breeze.
Why Should I Use It?
There is a multitude of reasons to use these wonderful charts. Gantt charts were designed to keep everyone on the same page. Team members know exactly when and what to work on. Underworked members are assigned more tasks, while overworked members aren’t overburdened.
You should use Gantt charts because:
*You won’t get lost. What to do after x task is always clear
*You save time. Team members don’t have to figure out what to do next after they complete a task. There’s less micromanaging
*You won’t overwork your team. If one member has 3 large tasks due in a week, you know not to pile on more
*On the other hand, underworked team members can be assigned tasks to fill up their schedule
Naturally, when saving time and keeping everybody motivated, projects get done efficiently, sometimes under budget!
Are Gantt Charts For Me?
If you find yourself constantly scrambling to find tasks for your team, Gantt charts are your best friend. Gantt charts solve three things. Clarity, motivation, and efficiency.
Clarity
*Do you know what needs to be done next?
*What needs to be done this week? How about next week? Next month?
*Do your team members know exactly what they need to work on?
If you can answer these questions with confidence, you may not need a Gantt chart. On the other hand, if there’s some room to improve in this area, a chart is the perfect solution.
Motivation
*Are your team members overworked?
*Are they bored? Do they check emails just to pass time?
*Is everyone working on what they’re good at? Do they enjoy their work?
Generating motivation for a project is tricky. Not everybody can muster up a passion for some tasks. A Gantt chart allows you to effectively allocate tasks to team members. This gives your team more control over their work efforts. More importantly, this is where you can utilize each person’s strengths.
This may not completely solve a motivation problem, but it certainly minimizes the downsides.
Efficiency
*Are there team members with too little work?
*Are your team members doing the tasks they’re best suited for?
Gantt charts thrive on efficiency. Efficiency allows team members to work on what they’re good at, with definitive deadlines. If you feel like your team is at peak productivity, a Gantt chart may or may not help. Chances are, introducing the chart has a chance of increasing productivity significantly.
The Rise of Modern Gantt Chart tools
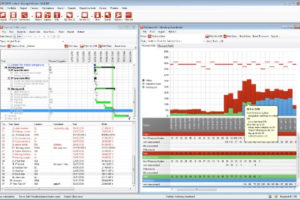
Gantt charts made their mark some time ago, starting with a simple whiteboard. This works. Though, it gets tricky when considering how a typical project goes. What happens when you need to extend a certain task by a day? Easy, just erase the end and extend with your marker.
What if you need to do this ten times in one day? What if you need to shift multiple tasks up by two days? As you can imagine, this gets messy in a heartbeat. This is where old school Gantt charts are bottlenecked. Project deadlines and requirements are wild. Project scope changes.
Modern Gantt chart tools are far more sophisticated. Technology gives you multiple advantages, including real-time collaboration, modern tooling, and real-time changes. Cool, right?
Real-Time Collaboration
*Project tweaks are reflected across everyone’s screen. It’s reactive
*These changes are also reflected across different time-zones and countries
Modern Tools
*Save your progress in the cloud, where results are never lost
*Easily change the project’s scope and requirements
*Shift tasks up, assign multiple members to a different task, and so on
It’s easy to see a modern chart’s benefits. Modern Gantt chart tools reflect the agile workflow. Deadlines change. So do requirements. Modern Gantt chart tools give you the tools to be adaptive to constant change.
The Only Gantt Chart Tool You’ll Need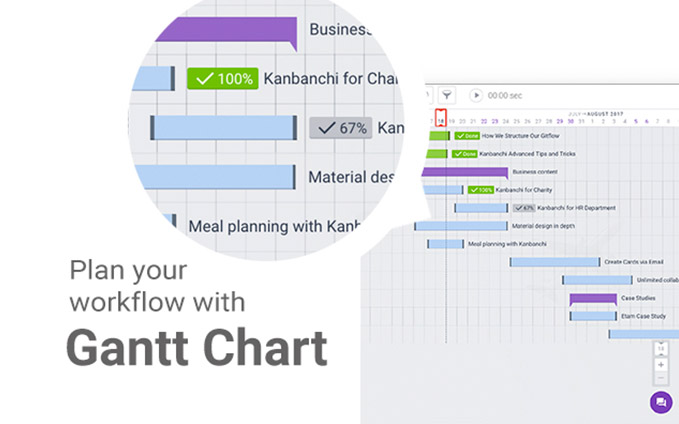
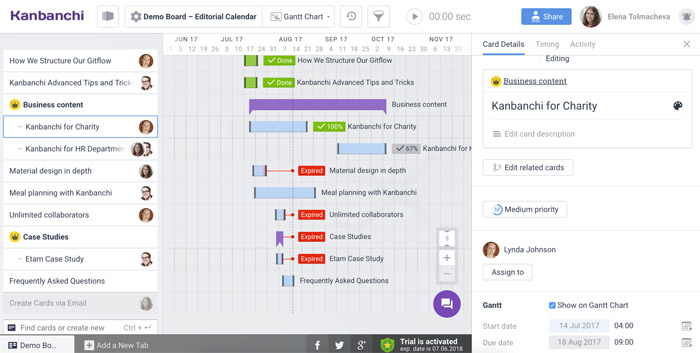
You know what Gantt charts are and why you should use them. Another question pops up. What should I use? Currently, there are many awesome options to choose from. MS Project, TeamGantt, SmartSheet, Instagantt, to name a few. Some of them are too complex, some are more hassle-free. Finding what works best can be tricky. A good starting point for just about any team is the Kanbanchi app.
If you’re not sure where to begin, Kanbanchi offers a fantastic starting point. Why? It’s simple, intuitive, and will get you started in no time. When starting with advanced Gantt chart tool, it’s easy to get overwhelmed with options. Kanbanchi makes navigating an interface easy for newcomers.
Kanbanchi also offers:
*An agile workflow, allowing your team to quickly and easily adapt to new project requirements
*A visually pleasing interface, which makes working easy and fun
*Seamless kanban board and Gantt chart integration. Switch between the card and chart view with no problem
*Changes to the kanban board are reflected on the Gantt chart, and vice versa
Overall, Kanbanchi packs useful functionality in a way that is easy to use and understand.
Let’s Get You Started!
Now that you know what a Gantt chart is and what to use, what’s stopping you? A Gantt chart tool can make team collaboration effortless in less than a day of using it! If you haven’t already, head over to the Kanbanchi home page and get started in seconds. It will immediately show you the productivity benefits of using a Gantt chart tool. Have fun, and happy charting!