Top 5 Dynamic Gantt Chart Components
Below is a list of the top 5 dynamic Gantt chart components available to software developers:
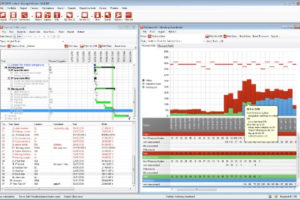
Bryntum Ext Gantt
The Ext Gantt by Bryntum is based on the Ext JS framework. Project schedules can easily be managed inside web applications. With an intuitive and interactive user interface, both mouse and keyboard can be used. It will import MS Project schedules and also export to PDF or PNG file formats. As an Ext JS component, its functionality can easily be extended for the development of custom plugins.
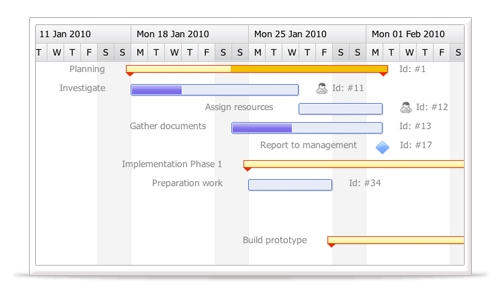
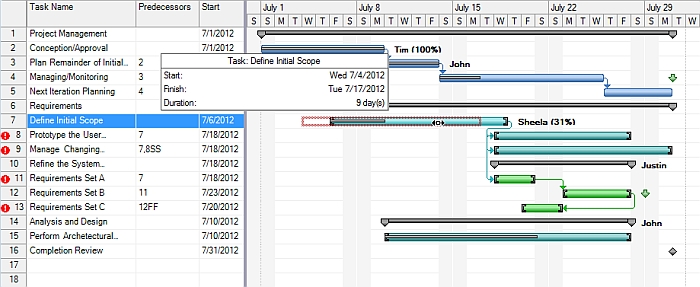
Telerik Kendo UI Gantt Chart
The Kendo UI Gantt Chart is a part of the Kendo UI Professional Package by Telerik for building sites and apps in HTML5 or JS. Its Gantt Chart widget is a powerful project management tool capable of visualizing tasks in treelist view, timeline view or combined view. In the treelist view, columns are editable and sortable. In the timeline view, users can choose to show the timeline in day, week or month. The tasks can be directly manipulated to change its start and end dates and its dependencies.
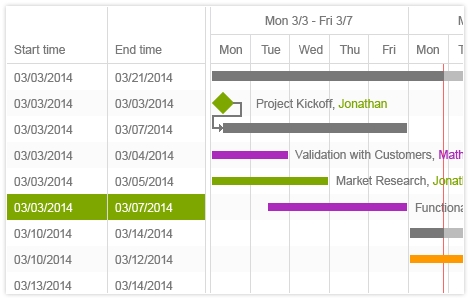
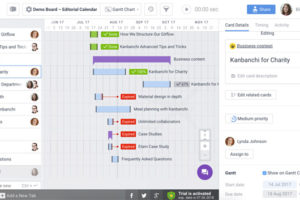
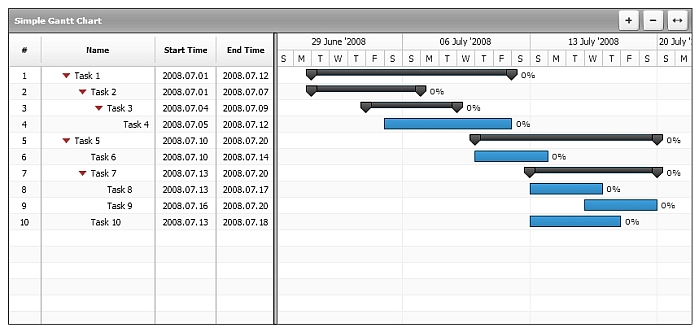
dhtmlxGantt
The open source JavaScript Gantt Chart from dhtmlx is a highly interactive and useful tool for web-based project planning applications. It provides basic chart functions, filtering and zooming, and can even show an hours scale view. It shows projects and tasks hierarchically on the left pane and can show different types of dependencies as lines. Tool tips can be enabled to show quick info, and the API is flexible to handle a large number of events for further customization.
ComponentOne GanttView for WinForms
GanttView for WinForms from ComponentOne is a complete project management tool that delivers an MS Project-like user experience with its support for the .Net platform. From a list of tasks, durations and constraints, it can automatically generate a schedule diagram, which can then be manually edited through tabular grids, dialog boxes, and click and drag action on bars within the chart pane. Calendars can be configured for custom weeks, time, and exceptions. Task constraints can be set and dependencies assigned. Bar styles are customizable for pattern, shape and color.
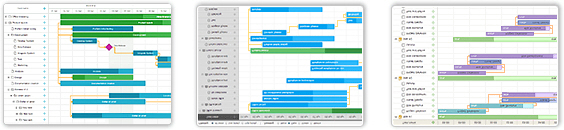
AnyChart AnyGantt
AnyGantt Gantt component is a cross-browser and cross-platform Flash-based data-visualization tool from AnyChart. It is an interactive and animated tool for building Gantt charts. Users do not need to have Flash skills or knowledge. It uses XML as its data interface. It can show diagrams for project progress or for resource utilization. It is compatible with scripting languages and can use sources such as text files, Excel, CSV formats and databases.
When Henry Gantt invented this type of chart, his goal was to know what each worker should do and did do, and what amount of work should be done and has been done. The 5 dynamic Gantt Charts listed above not only can show more information but also be used easily. Have you encountered other interesting Gantt chart components recently?