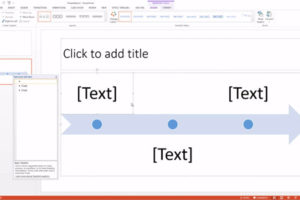
In this tutorial we will create a quick Gantt Chart in PowerPoint. A Gantt Chart is a horizontal chart that shows project progress over time. They can show weeks, months, or even years.
First go to Insert, Chart, and then Bar. The best to use for Gantt Charts are 2-D bars or 3-D cones, we’ll be using 2-D bars.
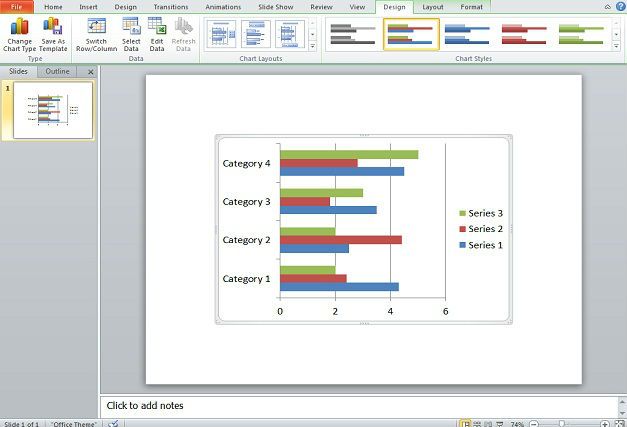
Since PowerPoint 2010 opens with Excel whenever a chart or graph is being made we will be using this for the barebones part of the chart. In this example, we’re doing six quarters Q1 2013 to Q2 2014. So we’ll want to stretch the blue border to G4 in Excel. This will give us an extra space in the PowerPoint chart.
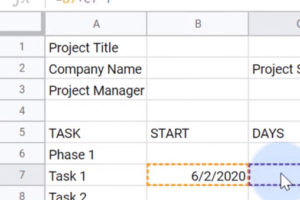
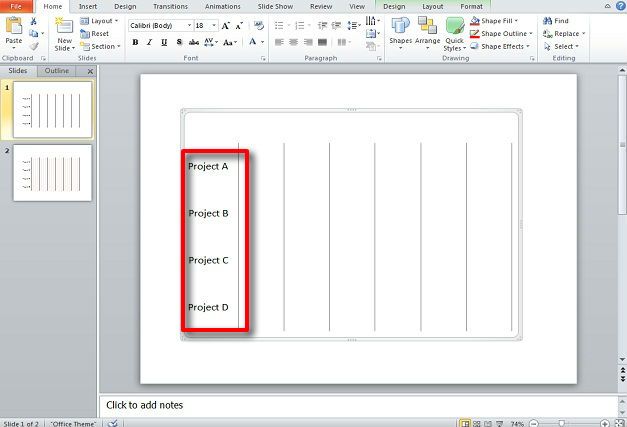
While still in Excel, edit the Category listings with your projects to be completed. We suggest doing so in Z to A order as opposed to A to Z. After this is done, you will have the bulk of what the chart and we can delete the other objects in the Slide except for your project listing.
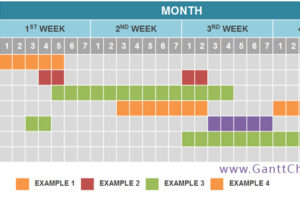
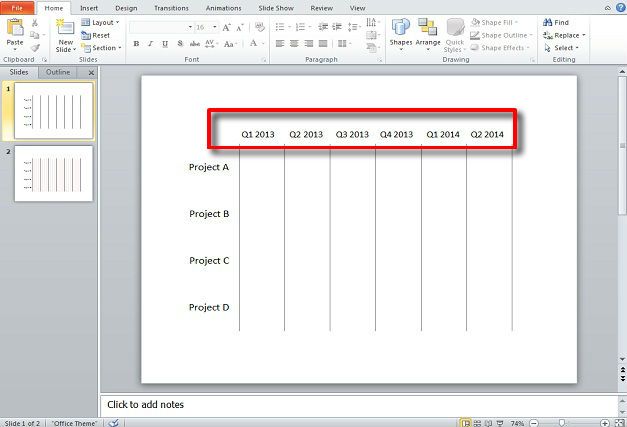
Next you will need to add a text box detailing the period of time to be covered. This text box should have months, years, weeks, quarters, or whatever your measure of time is based on. In this case we’re using quarters. Space the times between the graph lines properly for your Gantt Chart.
In the case of quarters, you’ll need some indication of months. This could be another text box underneath it, but for the sake of tidiness, we’re using three lines in the space beneath the quarters. Draw your lines of even size and group them. Then copy them in the other paces and group all of the lines together. We suggest moving this group to the back.
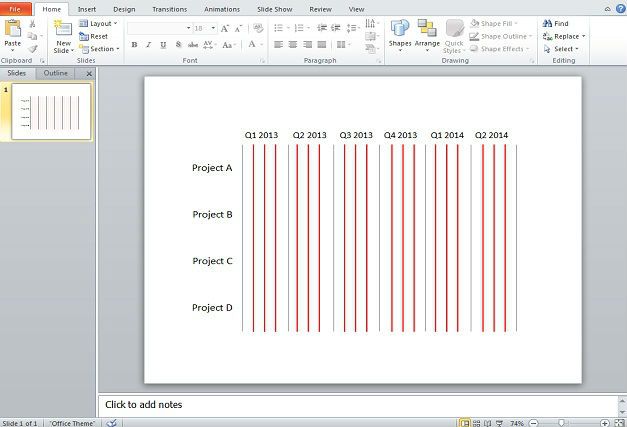
We also suggest fading them so that they don’t stick out too much.
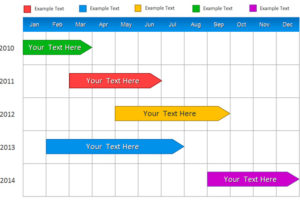
Next, you will use shapes as markers to show the duration a project should run for. Start at one of the lines indicating months. For example, a project running from January 2012 to May 2012 could possibly be indicated with a rounded rectangle stretched from Q1’s first month to Q2’s second month.
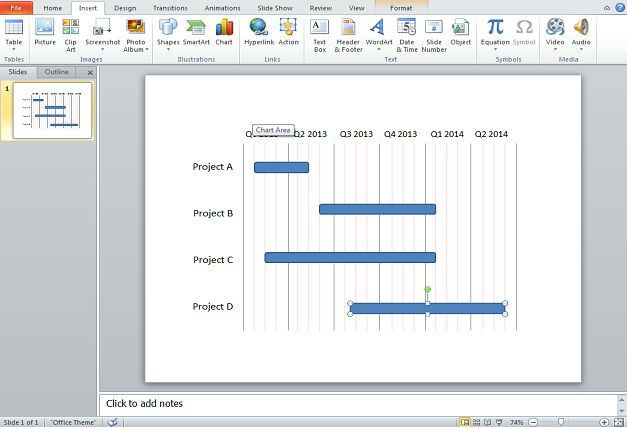
After this is done, format bars and text as desired.
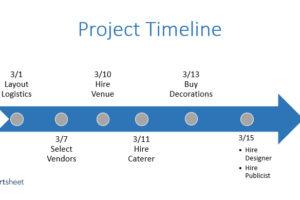
It is suggested you use a Gantt Chart template which can be found online for more complex, intricate charts. The template can be loaded into PowerPoint and edited as you wish. The Calendar function in PowerPoint can also serve as a form of Gantt Chart for specific days and weeks.
While starting a new project, you can type project timeline or timeline project in the Office.com template search box. It will turn up several templates that use a base format of the Gantt Chart.
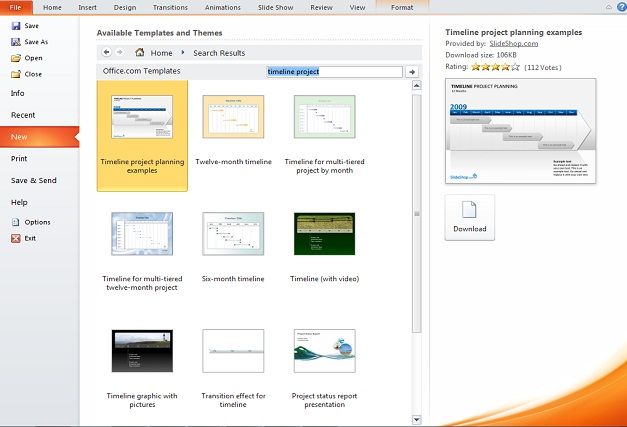
Once a chart is selected, it can be edited as desired.