It is difficult to envisage how a modern project would be managed without at some point creating a chart of tasks to be done in delivering the project’s declared benefits. One of the most enduring types of chart is the Gantt chart.
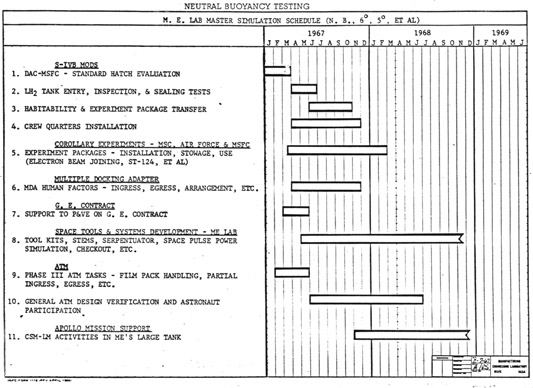
In its most common modern format this plots a list of deliverables on one axis against time on the other axis. The concept was first developed around the turn of the 19th Century by American Henry L. Gantt, who, working with a colleague Frederick Taylor devised a method of describing production planning and resource loading for factories and workshops. In truth, the first ‘Gantt charts’ were more like tables than charts, though this was one of the first instances of the deliverable-vs-time concept.
In a quite different age where people’s word was their bond, the Gantt chart was charmingly described thus:
If a promise of a delivery is to be kept, all the work in a plant must be planned so accurately that when a new order is received, it is possible to tell almost to a day when the work will be completed. The Gantt progress chart enables the manager to keep before him all the promises he has made, to concentrate his attention on overcoming obstacles and avoiding delays, and, when it is impossible to live up to a promise, it enables him to give the customer advance notice of the fact. (Wallace Clark – ref.1).
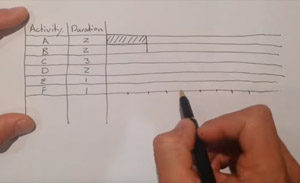
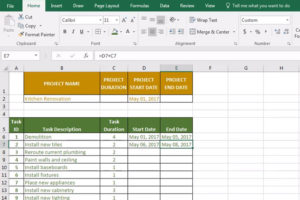
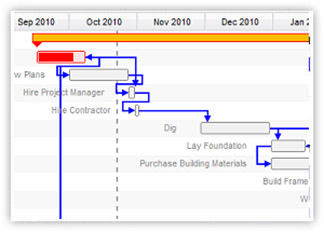
Before computers, Gantt charts were drawn by hand as Bar Charts, a term that has since become synonymous with ‘Gantt chart’, and these required manual revisions each time something changed. A simple Gantt chart might have looked like this:
If there was a precedent logic linking one task to another, it would normally be shown by the start of task two being drawn following the completion of task one, and so on. Critical paths could be highlighted easily enough, but manually!
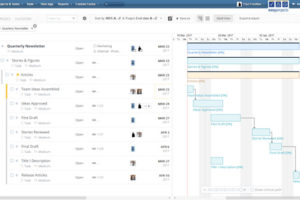
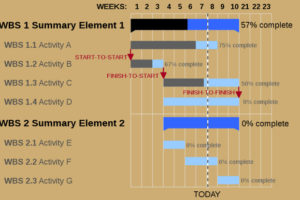
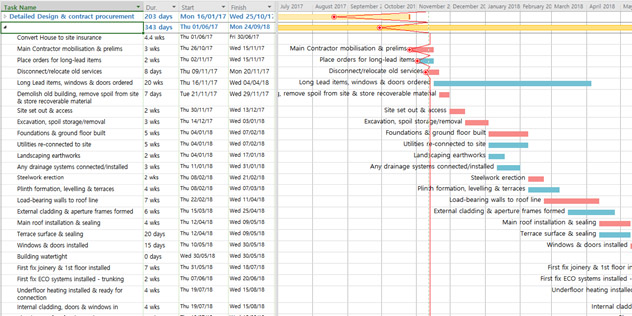
As modern computers became more powerful it became easier to write programmes that calculated the impact of linking logic on deliverable dates, and crucially allowed changes in critical path, float and so on to be displayed quickly on screen and hard copy reports. The advent of graphical user interfaces such as Windows and the Macintosh allowed planners to manipulate logic, time and resource loading on screen. It became possible to overlay the linking logic onto the Gantt chart, although in a complex programme this could become difficult to follow (and is often best shown in a PERT chart):
The speed of modern PCs allows ‘what-if’ modelling to be done almost instantaneously (only 25 years ago I remember leaving a PC to run overnight to update a large programme).
Other current developments allow impacts such as risk change durations on a Gantt chart according to statistically-generated algorithms. It is normal these days for Time Now / Data Date to be graphically identified and for progress to be shown along the bars of the chart. Most modern systems allow baseline bars to be shown alongside the current forecast bars to indicate performance, since it this can help to explain variances on Earned Value S-curves.
The calculations needed to maintain overlapping logic, leads, lags and ladders could easily be handled by the computing power of our age (although there are documented cases where this went badly wrong).
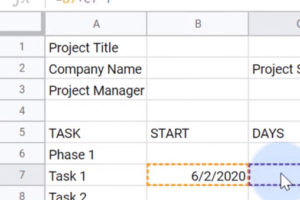
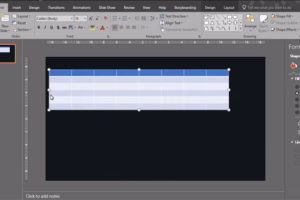
Although there are scores of software tools that allow project models to be built, tested, updated and displayed in several formats, it is still common today to receive Gantt charts that have been ‘drawn manually on a computer’, for example in Excel or even PowerPoint. Of course, they look great, but there is no logic holding them together, and they rarely get updated!
Nevertheless, however they are produced it is usually the Gantt chart that is cited in contracts, even held up in court as evidence. This is due to its inherent simplicity. If Henry Gantt were alive today, he would instantly recognise a modern Gantt chart as the descendent of his original concept.